Introduction to Functions
A mathematical model is an abstract concept through which we use mathematical language and notation to describe a phenomenon in the world around us. One example of a mathematical model is found in Dolbear's Law. In the late 1800s, the physicist Amos Dolbear was listening to crickets chirp and noticed a pattern: how frequently the crickets chirped seemed to be connected to the outside temperature. If we let $T$ represent the temperature in degrees Fahrenheit and $N$ the number of chirps per minute, we can summarize Dolbear's observations in the following table.
| T (temp in F) | 50 | 60 | 70 | 80 |
|---|---|---|---|---|
| N (chirps per min) | 40 | 80 | 120 | 160 |
We can think of the temperature as an input value $x$, and then $f(x) = N$ is a function that produces the number of chirps. In other words, we assume must be some mathematical equation that tells me how to take the input, temp in Fahrenheit, and use math operations to produce the output, the number of chirps per miniute. For a mathematical model, we often seek an algebraic formula that captures observed behavior accurately and can be used to predict behavior not yet observed. Let's translate our chart into a set of ordered pairs.
Relationship or Function
Using the previous chart we can set up the set of order pairs as so:
$$\{(50,40),(60,80),(70,120),(80,160)\}$$A relation is a set of ordered pairs. The set of the first components of each ordered pair is called the domain and the set of the second components of each ordered pair is called the range. We list them as sets of numbers or intervals, for our relationship
- Domain: $\{50,60,70,80\}$
- Range: $\{40,80,120,160\}$
Note that each value in the domain is also known as an input value, or independent variable, and is often labeled with the lowercase letter $x$. Each value in the range is also known as an output value, or dependent variable, and is often labeled lowercase letter $y$. While it is true all functions are relationships, that is they take inputs and produce outputs using math, there one key feature that sets functions apart from relationships...
More on what makes a functions
A function $f$ is a relation that assigns a single value in the range to each value in the domain. In other words, no $x$-values are repeated. In our previous example we see that no $x$-value take on more than one $y$-value. But let's look at a new one:
$$\{(1,1),(1,2),(1,3),(1,4),(1,5)\}$$Notice that our domain is the singleton set $\{1\}$ is not paired with exactly one element in the range, $\{1,2,3,4,5\}$, but instead is paired with all of the values in the range. Take note it only takes one repeat for a relationship to lose it statis as a funtions.
The technical definition of a function
Def 1.1 A function is a process that may be applied to a collection of input values to produce a corresponding collection of output values in such a way that the process produces one and only one output value for any single input value.
In technical math writing you will often see $F: A \rightarrow B$ which is just a short way of saying the function $F$ maps the domain $A$ to values in the range $B$. In our class $A$ will almost always be the real number line or segments of the real number line.
A general visualization of what makes a function
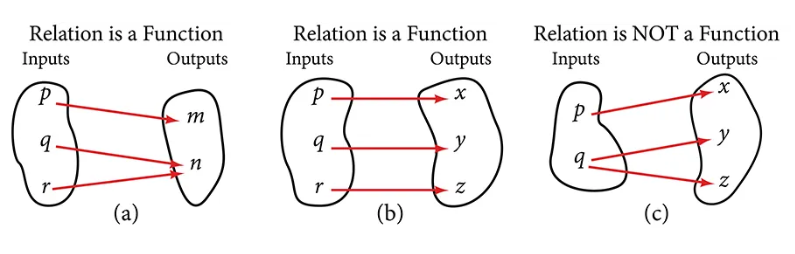
(a) This relationship is a function because each input is associated with a single output. Note that input $q$ and $r$ both give output $n$. (b) This relationship is also a function. In this case, each input is associated with a single output. (c) This relationship is not a function because input $q$ is associated with two different outputs.
Looking at our previous examples
In the graph on the left we see the Dolbear example, and the one on the right is of our non-function relation.
Key Idea: notice that the the non-function relation on the right forms a vertical line. This will be important soon for our testing of functions!
Using Function Notation
We have spent time working on determing if a relation is a fucntion, now lets look at the mathematical notation:
$$y = f(x)$$This defines a function named $f$. We are free to name our functions what we want, but the most common names in math are $f,g,h$. The letter $x$ represents the input value, or independent variable. The letter $y$, or $f(x)$, represents the output value, or dependent variable. In this course we will be studying several familes of functions. That is functions whose equations have simular charactistics. Here is a few examples, see if you can guess which ones belong to the same family.
- $f(x) = x^2$
- $f(x) = 3$
- $f(x) = 3x^3 + 7$
- $f(x) = e^{x-1}$
- $f(x) = \frac{x+1}{x^2 - 3x + 4}$
Evaluating functions
Often in this class you will be asked to evaluate a function for a given value. This means that you are to "plug" that value into your defined equation and get the output. For example let's say we have defined the function $f(x) = 2x^2 + 2$ and I ask you to evaluate that function at the value $x=4$ then:
$$f(4) = 2(4)^2 + 2 = 2(16) + 2 = 32 + 2 = 34$$Notice that everywhere I had an x, I replaced it with the value of 2. Then I just preformed arithmetic. But what if I said evaluate at $x = z + 2$:
$$f(z+2) = 2(z+2)^2 + 2 =$$ $$2(z^2 + 2z + 4) + 2 = 2z^2 + 4z + 8 + 2 = 2z^2 + 4z + 10$$We can evaluate functions at specific values, but we can also evaluate functions with other functions. The process of evaluating functions with other functions is called composition and we will study it in more depth later.
You try
Evaluate the following function at $x = 5$
$$f(x) = \frac{\sqrt{3x + 1}}{2}$$$f(5) = \frac{\sqrt{3(5) + 1}}{2}$
$ = \frac{\sqrt{15 + 1}}{2}$
$ = \frac{\sqrt{16}}{2}$
$ = \frac{4}{2} = 2$
Our first property and test
Some functions have a given output value that corresponds to two or more input values. However, some functions have only one input value for each output value, as well as having only one output for each input. We call these functions one-to-one functions.
| Letter Grade | Grade point average |
|---|---|
| A | 4.0 |
| B | 3.0 |
| C | 2.0 |
| D | 1.0 |
This grading system represents a one-to-one function, because each letter input yields one particular grade point average output and each grade point average corresponds to one input letter.
The grading system is also a descrete function because its domain and range are finite sets. In this course we will be looking mostly at continous functions. These are best visualized on desmos.
Vertical line test examples
Inspect the graph to see if any vertical line drawn would intersect the curve more than once. If there is any such line, determine that the graph does not represent a function.
Domain and Range
Def 1.2 Let $F$ be a function from $A$ to $B$. The set $A$ of possible inputs $F$ is called the domain of $F$; the set $B$ of potential outputs from $F$ is called the codomain of $F$.
Notice that $B$ is not technically the range, there is a more specific definition for the range:
Def 1.3 Let $F$ be a function from $A$ to $B$. The range of is the collection of all actual outputs of the function. That is, the range is the collectio of all elements $y$ in $B$ for which it is possible to find an element $x$ in $A$ such that $F(x) = y$
In many situations, the range of a function is much more challenging to determine than its codomain.
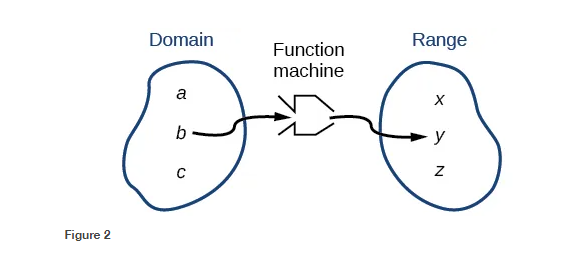
We can visualize the domain as a “holding area” that contains “raw materials” for a “function machine” and the range as another “holding area” for the machine’s products.
Interval notation
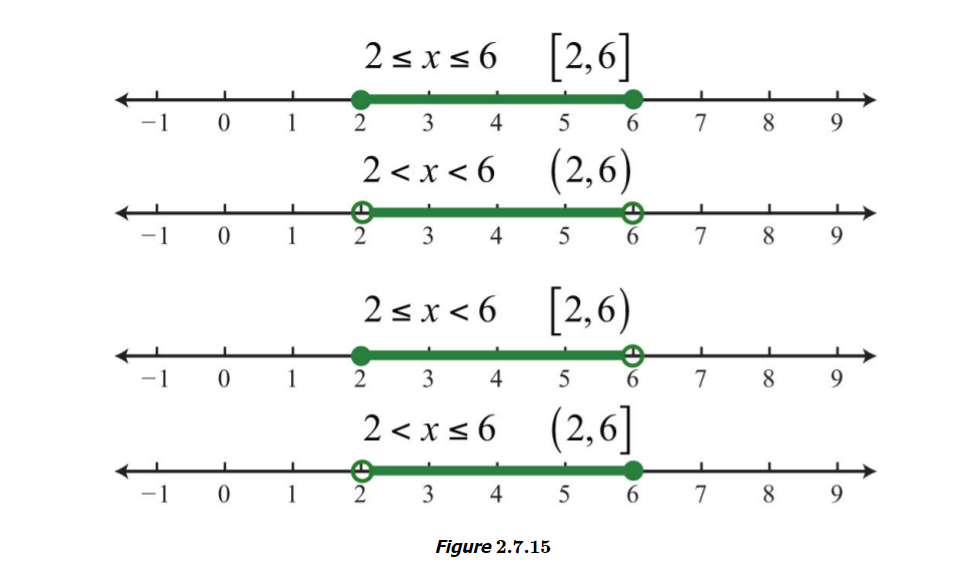
We can write the domain and range in interval notation, which uses values within brackets to describe a set of numbers. In interval notation, we use a square bracket $[$ when the set includes the endpoint and a parenthesis $($ to indicate that the endpoint is either not included or the interval is unbounded. Infinity will always get a $($ because it is not a number. Here are some visual examples:
What do you think a number line with Infinity in it would look like?
Examples with Infinity
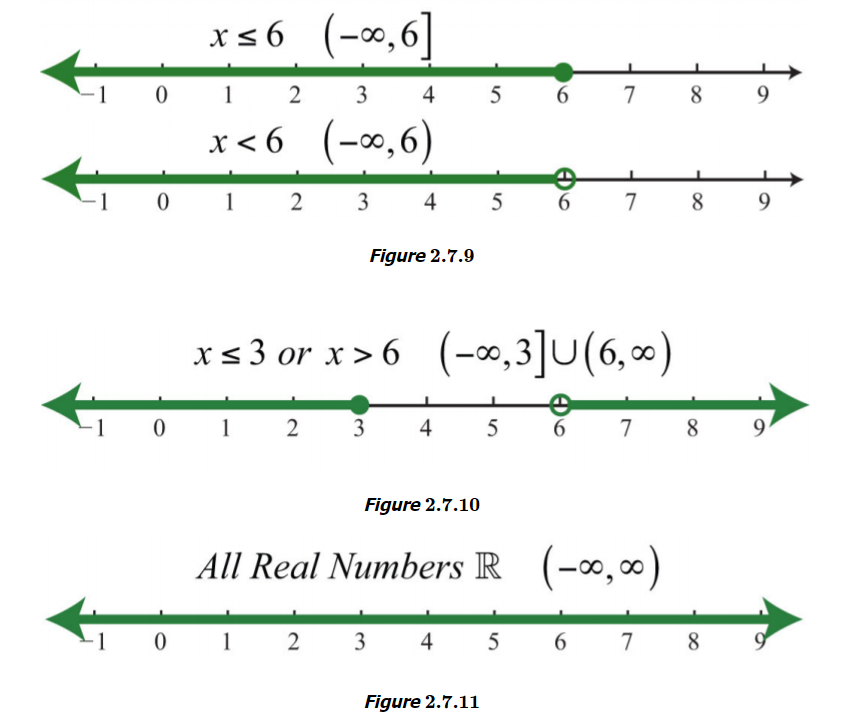
The conventions of interval notation:
- The smallest term from the interval is written first.
- The largest term in the interval is written second, following a comma.
- Parentheses, $($ or $)$, are used to signify that an endpoint is not included, called exclusive.
- Brackets, $[$ or $]$, are used to indicate that an endpoint is included, called inclusive.
A lot of functions have the set of all real numbers, $\mathbb{R}$, as both it's domain and range. Often when determing the domain and range, it is best to start with the assumption that it is all real numbers, then work though the possible restirction:
- We can not have negative values inside of radicals
- We can not divide by zero
Another helpful thing to do is to look at a visual of the graph when determing the domain and range.
Looking at our example graphs again
Determine which values are being used as inputs from the $x$ axis as the domain, and which values are being used as outputs from the $y$ axis as the range. Write you answer in interval notation.
Answers to previous slide
- $x^2$ D: $(-\infty,\infty)$ R: $[0,\infty)$
- $e^x$ D: $(-\infty,\infty)$ R: $(0,\infty)$
- $\log{x}$ D: $(0,\infty)$ R: $(-\infty,\infty)$
- $\sqrt{x}$ D: $(0,\infty)$ R: $(0,\infty)$
Note about $\sqrt{x}$, the general square root will not work under our definition of a function, but we can use the Principal Square Root, which is the unique nonnegative square root of a nonnegative real numbers. Another way to think about this is that we are restricting the codomain to be $[0, \infty )$. This is fine, both the Domain, $A$, and the Codomain, $B$, are controled by you. And any restriction of the codomain will automatically cause restrictions on the range. So going forward when you see some form of $f(x) = \sqrt{x}$, know that we are talking about the principal square root.
Summary and support
A function is a process that generates a relationship between two collections of quantities. The function associates each member of a collection of input values with one and only one member of the collection of output values. A function can be described or defined by words, by a table of values, by a graph, or by a formula.
Here are some helpful links to video examples of finding domain and range:
Examples of finding the domain of functions that need restrictions: LINK
Examples of finding the range of a fucntion: LINK